
This project delves into the rich field of ancient Chinese bibliography, using advanced data analysis and visualization techniques to uncover trends and patterns in bibliographic data across various Chinese dynasties. It includes an interactive word cloud for exploring character differences, a zoomable Sunburst graph for examining the distribution of works, and a Bump Chart for analyzing preservation efforts over time. These tools make the complex world of ancient Chinese literature more accessible to scholars and enthusiasts alike.
Interactive Word Cloud
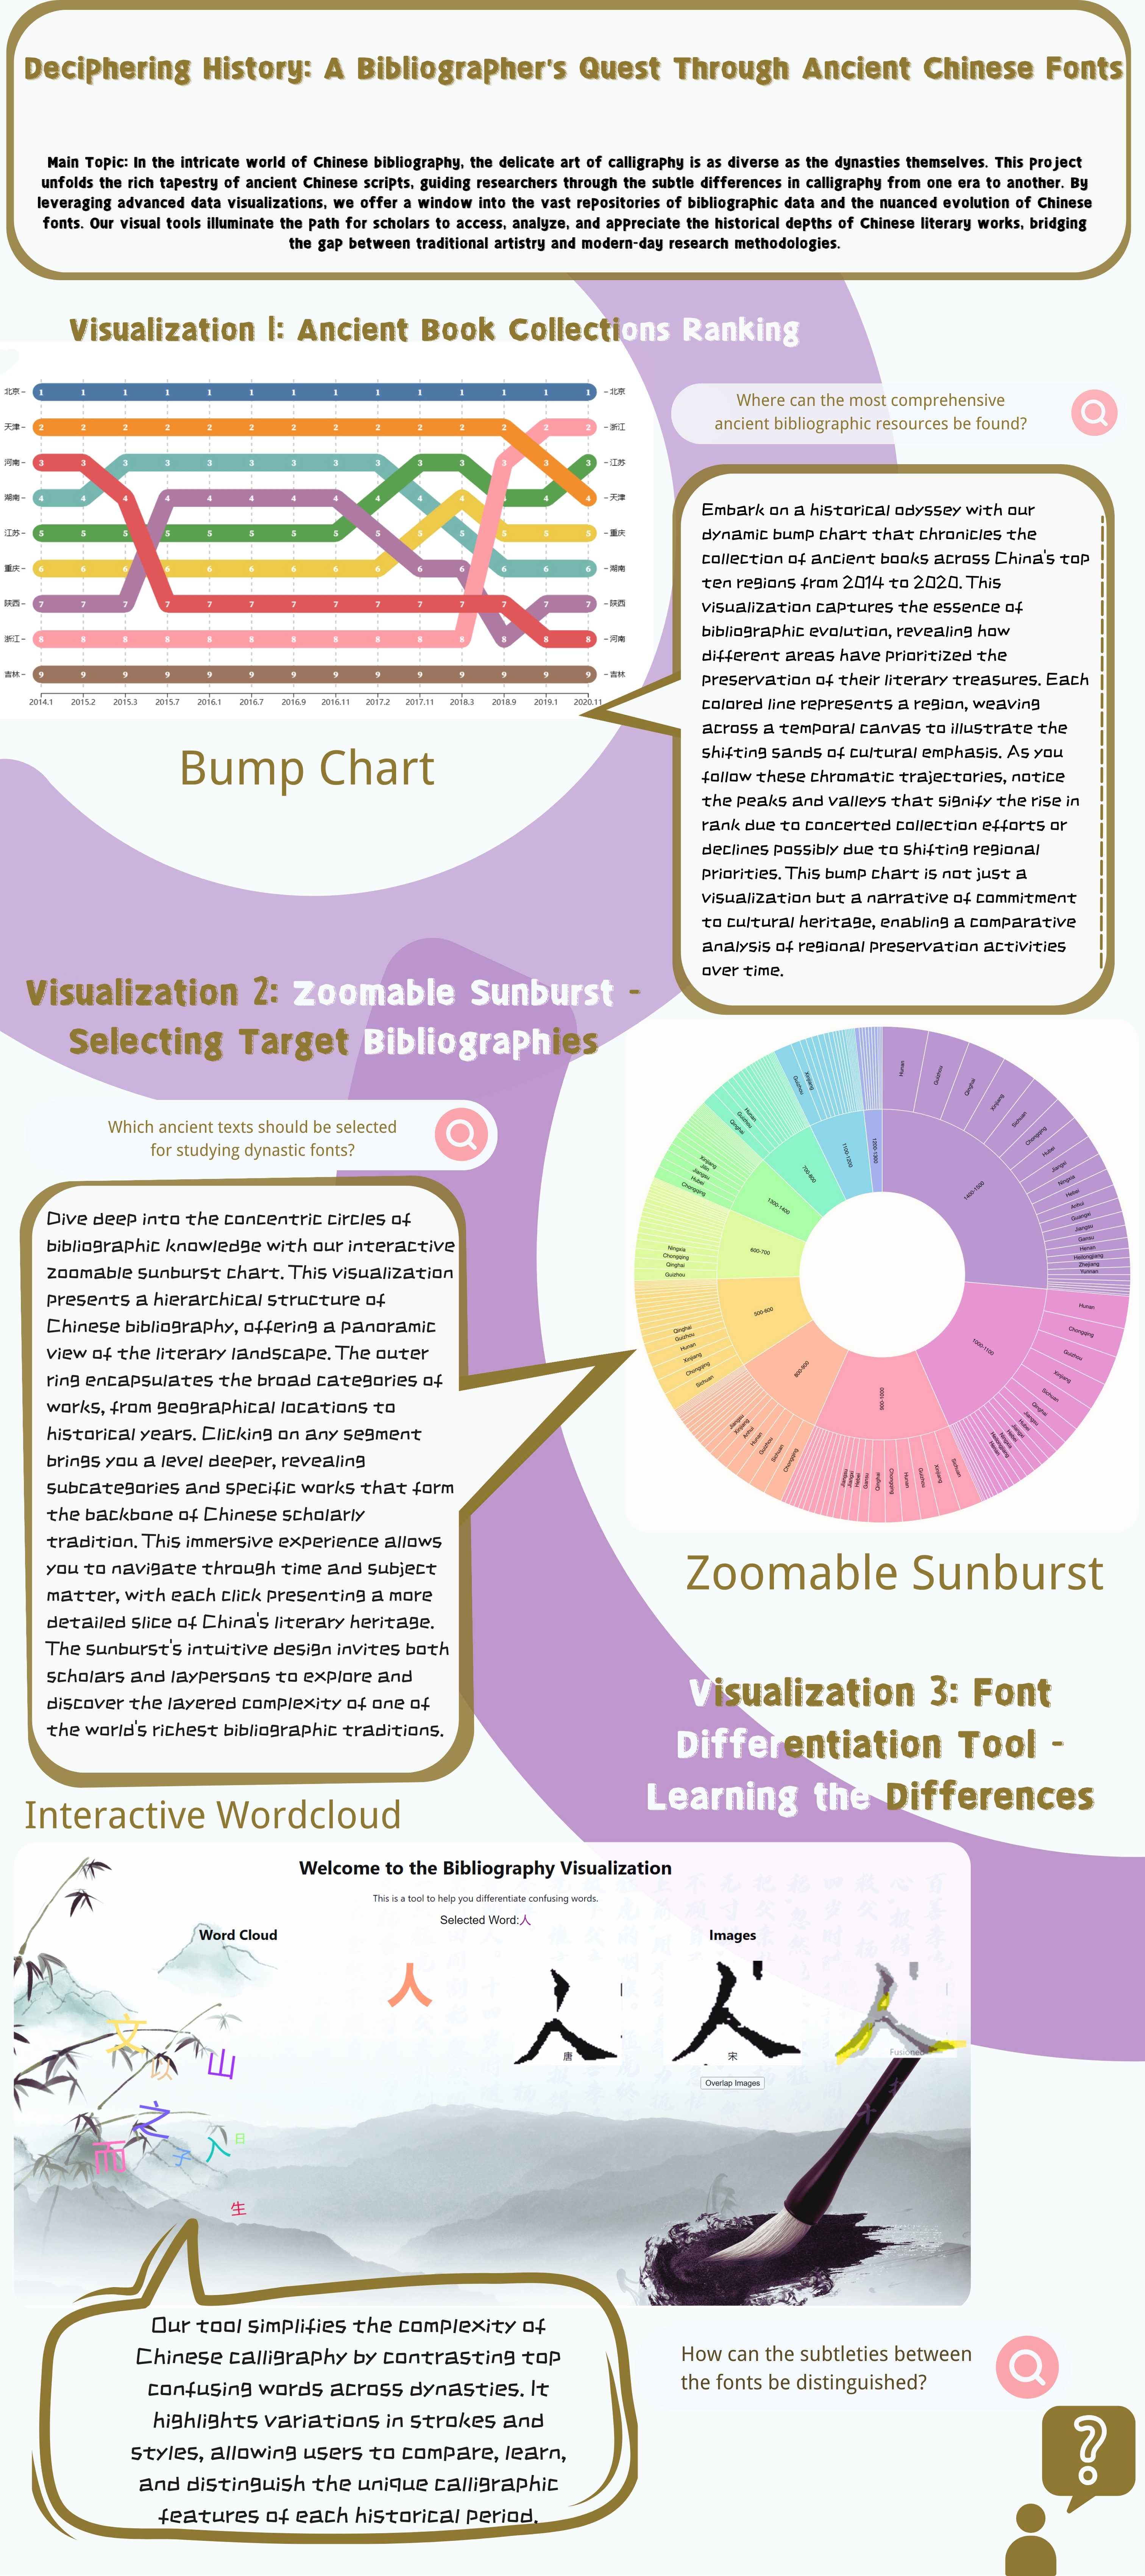
Explore the nuances of ancient Chinese characters through this dynamic word cloud.
Interactive Word Cloud Visualization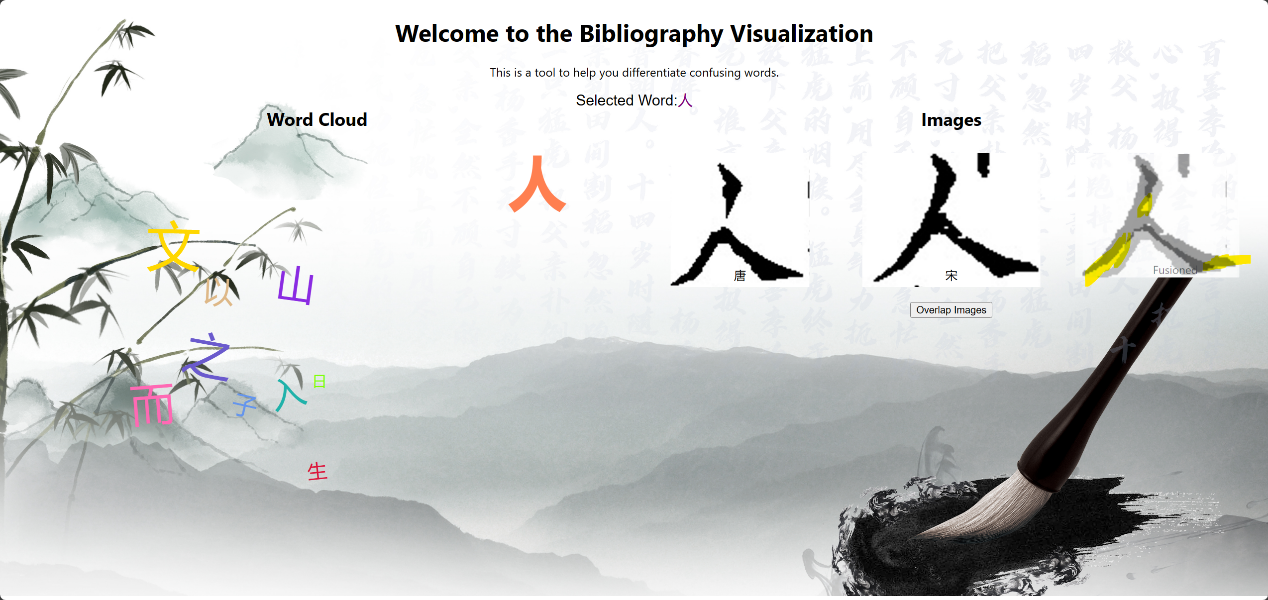
Zoomable Sunburst
Dive into the distribution of bibliographic works with this detailed radial visualization.
Zoomable Sunburst Visualization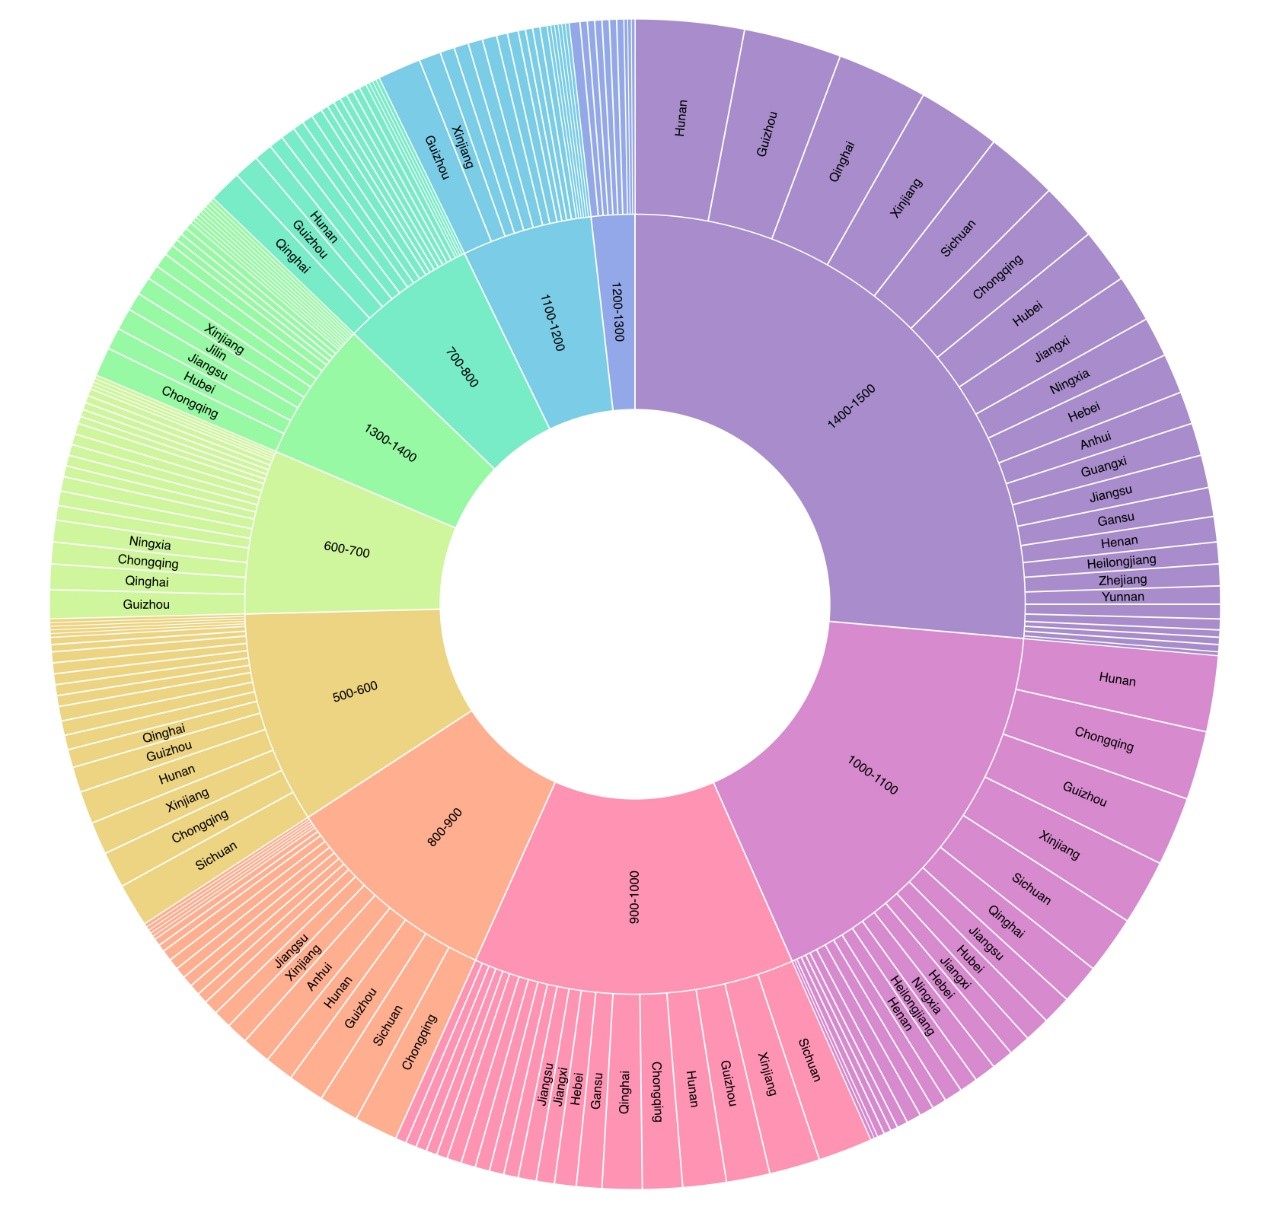
Bump Chart
Analyze the trends in the preservation of ancient books across different regions over six years.
Bump Chart Visualization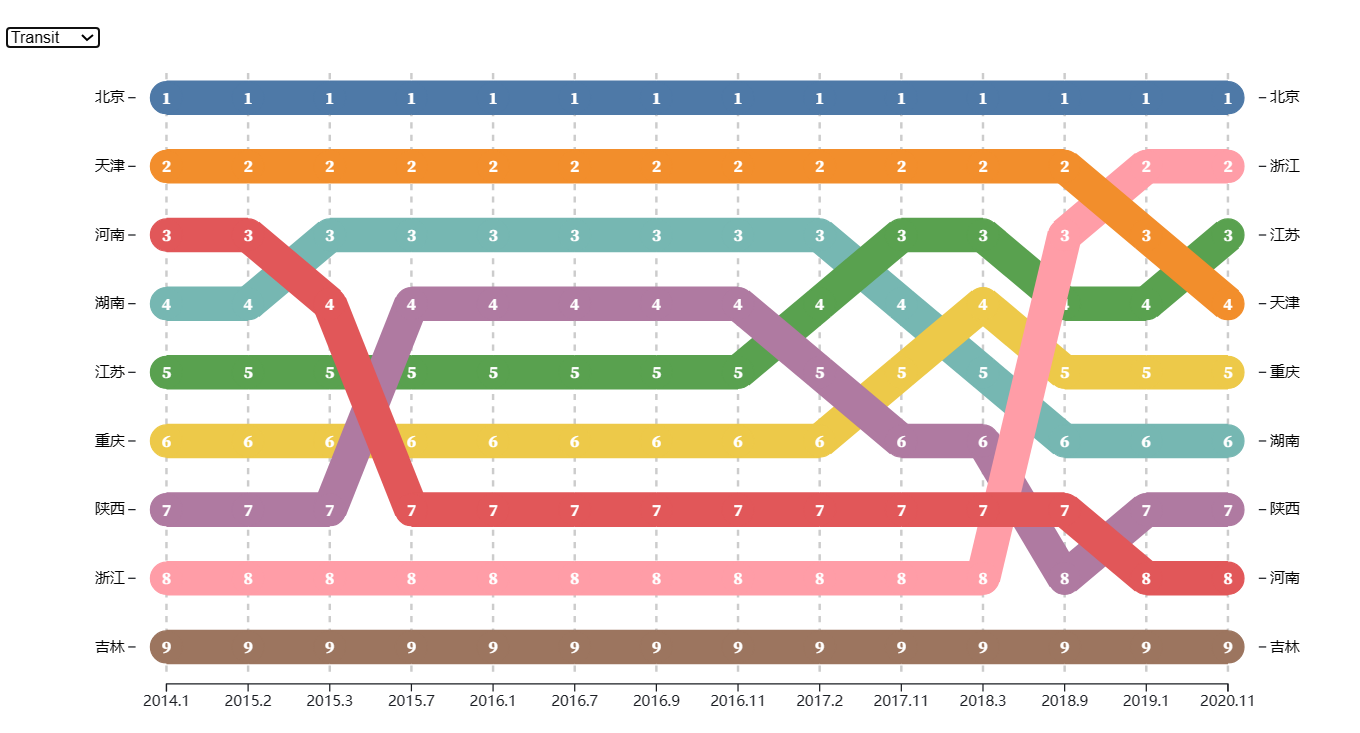
Poster
For more detailed information, please read the text below ⬇
Unraveling the Mysteries of Ancient Chinese Bibliography: A Data-Driven Approach
Introduction
In the realm of ancient Chinese bibliography, there lies a rich tapestry of information that has long remained enigmatic due to its complexity and the vastness of its scope. My endeavor, a project at the intersection of data science and historical scholarship, sought to demystify this domain. By harnessing cutting-edge data visualization tools, I aimed to reveal macro trends in bibliographic store data and provide an accessible platform for exploring ancient Chinese fonts and bibliographic history.
Methodology
Data Acquisition
Our journey began with the compilation of a diverse dataset, sourced primarily from Wuhan University, enhanced with InceptionResNet-processed data. Simulated datasets, comprising publication years, regions, publishers, authors, genres, and titles, were generated using Python. Additionally, to capture ancient storage data across different provinces, I employed web scraping techniques with Beautifulsoup4.
Visualization Strategies
I developed interactive tools to analyze and present our findings, using a blend of technologies:
- React: For an interactive word cloud, offering a comparative view of fonts across dynasties.
- JavaScript and D3.js: Utilized to create a dynamic, zoomable Sunburst graph and a Bump Chart, offering rich, multi-layered insights.
Results and Tools
Interactive Word Cloud
This feature allows users to delve into the intricacies of confused characters, enhancing understanding of subtle differences.
Zoomable Sunburst
An innovative radial layout that empowers users to explore bibliographic data distributed across various dimensions such as time, location, and authorship.
Zoomable Sunburst Visualization
Bump Chart
A visualization that eloquently captures the ebb and flow of ancient book preservation efforts across different regions over a span of six years.
Challenges
Throughout the project, we encountered several challenges:
- High-resolution Imagery: Necessary for distinguishing subtle typographic differences in the word cloud.
- Performance Issues: Encountered with large datasets in the Sunburst visualization.
To overcome these, later work may need to optimized image resources for balance and employed more powerful backend solutions for data handling.
Conclusion
This project represents a significant stride in unveiling the extensive and complex landscape of ancient Chinese bibliography. By employing interactive data visualization techniques, it offers a platform where scholars and enthusiasts alike can explore and appreciate the rich heritage of Chinese literature in ways previously unimagined.
Project Contributions
- Data collection and processing
- Implementation of interactive visualizations
- Website design
- Poster creation
Note: Part of the data is simulated, please do not take them as real data